

Help
 
1. About PSDAP
PSDAP (Pharmacological Signature Dataset and Annotation Platform) is a curated dataset of perturbagen-induced transcriptomic signatures collected from publicly available pharmacological and herbal medicine resources. The dataset integrates treatment-control comparison profiles generated from bioactive compounds, herbal ingredients, medicinal herbs, and herbal formulas across diverse experimental systems and biological models. For each profile, PSDAP provides curated metadata, differential expression statistics, pathway enrichment results, disease term enrichment results, and similarity scores to other perturbagen-induced transcriptomic signatures within the dataset. PSDAP aims to support systematic exploration and comparison of transcriptional responses induced by pharmacological and herbal perturbagens.
2. What is a signature profile?
In PSDAP, a signature profile represents one treatment–control matched comparison and its corresponding differential gene expression signature.  A signature profile summarizes genes significantly altered in response to perturbagen treatment relative to the matched control condition.  Gene-level differential expression results include gene symbols, log2fold-change, P value, and adjusted P value.  Therefore, the number of signature profiles in PSDAP corresponds to the number of curated treatment–control comparison-based transcriptomic signatures.
3. Perturbagen categories
PSDAP classifies perturbagens into four categories according to their source, usage, and metadata context. Most small molecule perturbagens are classified as bioactive compounds.  Compounds are classified as herbal ingredients only when the source metadata explicitly annotates them as constituents of medicinal herbs or herbal formulas.
Category Definition Examples
Bioactive compound A single chemical compound with reported biological or pharmacological activity.  This category includes most small molecules used to generate perturbagen-induced transcriptomic signatures, unless they are specifically annotated as herbal ingredients in the source metadata. LOVASTATIN,
TRIMETHADIONE,
INDOTECAN
Herbal ingredient A single chemical constituent identified as a component of a medicinal herb or herbal formula based on the metadata provided by the original source database.  Although these compounds may also be bioactive compounds, they are classified as herbal ingredients when their herbal origin is explicitly annotated. KAEMPFEROL,
GALLIC ACID,
GINSENOSIDE RB1
Medicinal herb A single medicinal herb, crude herbal material, or medicinal natural material used as a perturbagen. PANAX GINSENG,
GLYCYRRHIZAE RADIX,
ASTRAGALI RADIX
Herbal formula A multi-herb prescription or herbal preparation composed of two or more medicinal herbs. SAMUL-TANG,
BOJUNGIKGI-TANG,
YIJUNG-TANG
4. How to use the Analysis page
The Analysis page allows users to identify signature profiles of interest and examine their differential expression, pathway enrichment, disease enrichment, and drug-drug similarity results.

Select one of the four perturbagen categories: Bioactive compound, Herbal ingredient, Medicinal herb, or Herbal formula. The remaining filters are updated according to the selected category.
Select a perturbagen category

Select one data source available for the selected perturbagen category.
Select a data source

Filter signature profiles by experimental system and species, such as in vitro human cell models or in vivo animal models.
Select an experimental system and species

Select one or more biological models used for transcriptomic profiling, including a cell line, tissue, or primary cell model.
Select a model name

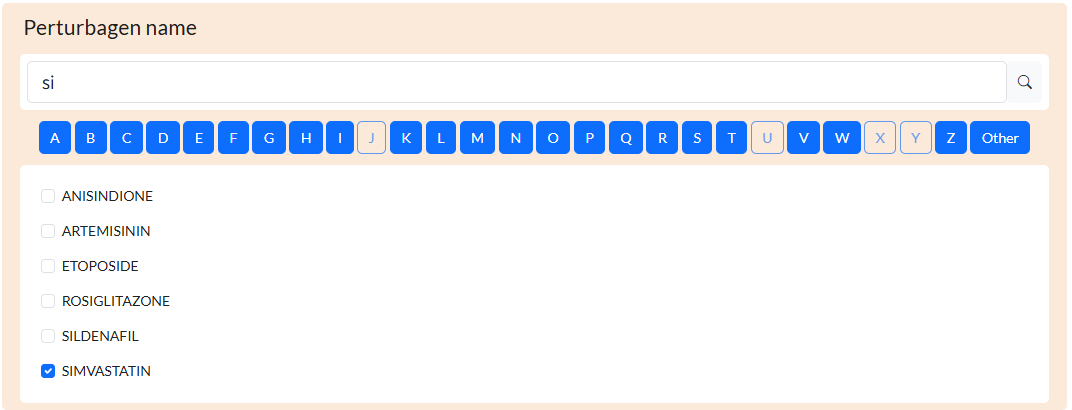
Type a perturbagen name in the search box or select one from the available list.
Select a perturbagen
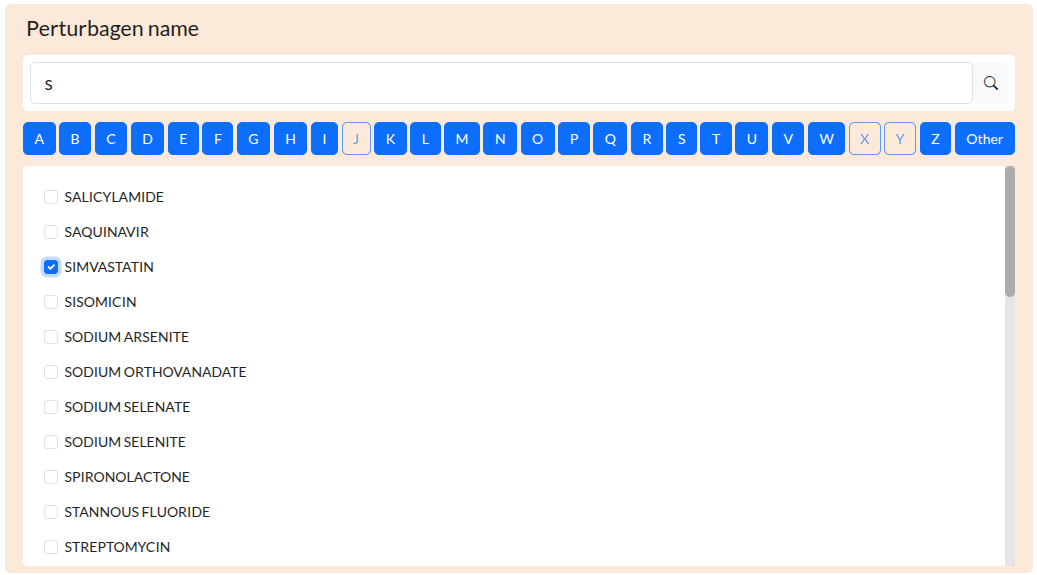
Alternatively, click an alphabet highlighted in blue to display perturbagens matching the selected category and filters.
Select a perturbagen

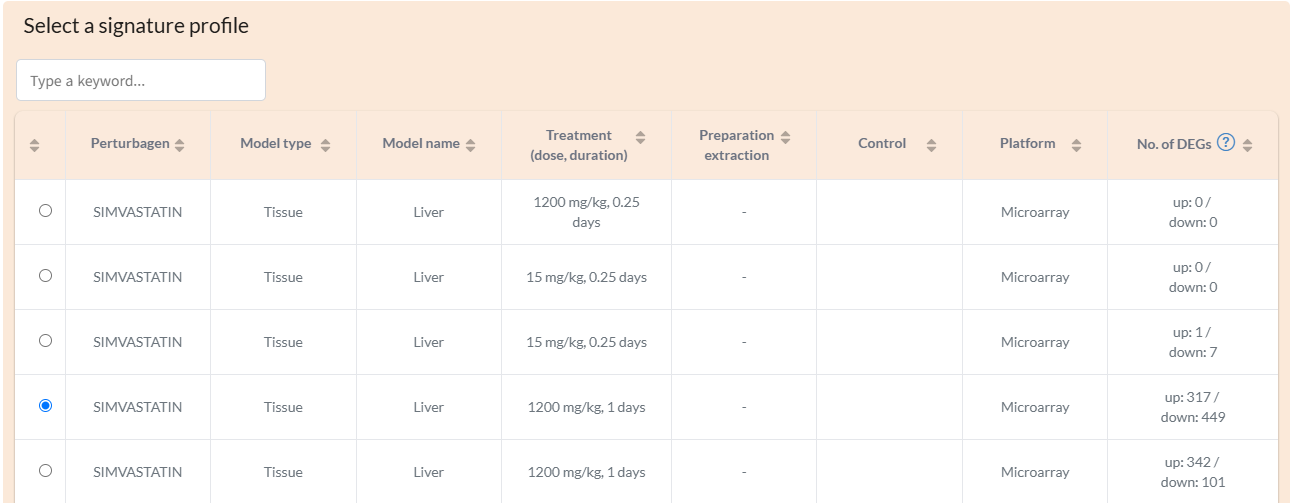
Select one signature profile from the list matching the filters selected in Steps 1–5.  Each profile includes the data source, treatment/control conditions, experimental model, profiling platform, and the maximum DEG count across the predefined DEG selection criteria.
Select a signature profile

Click the analysis button to view the results associated with the selected signature profile, including gene-level differential expression results, pathway enrichment, disease term enrichment, and a list of the most similar drug-induced signatures in PSDAP.
Run analysis

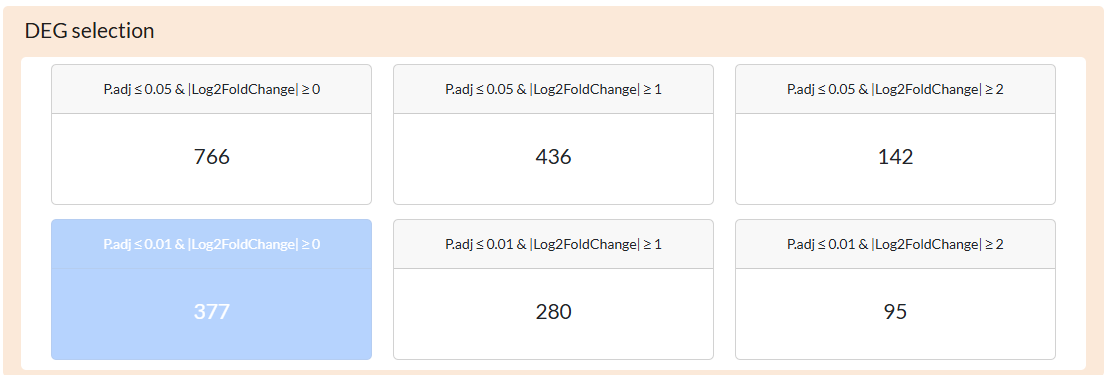
Six DEG count cards are displayed for fold-change-based profiles, each corresponding to a predefined criterion based on log2fold-change and adjusted P value.  Select one card to apply the corresponding cutoff.  The number shown on each card indicates the number of DEGs identified under that criterion.  The selected gene set is used for downstream pathway and disease enrichment analyses.  For CMap Level 5 profiles, no DEG criterion selection is required.  The top 100 and bottom 100 genes ranked by MODZ score are predefined as the up- and down-regulated gene sets, respectively.  CMap Level 5 signatures are represented by replicate-collapsed moderated z-scores (MODZ).  Subramanian, A. et al. A Next Generation Connectivity Map: L1000 Platform and the First 1,000,000 Profiles. Cell 171, 1437–1452.e17 (2017).
Select DEG criteria

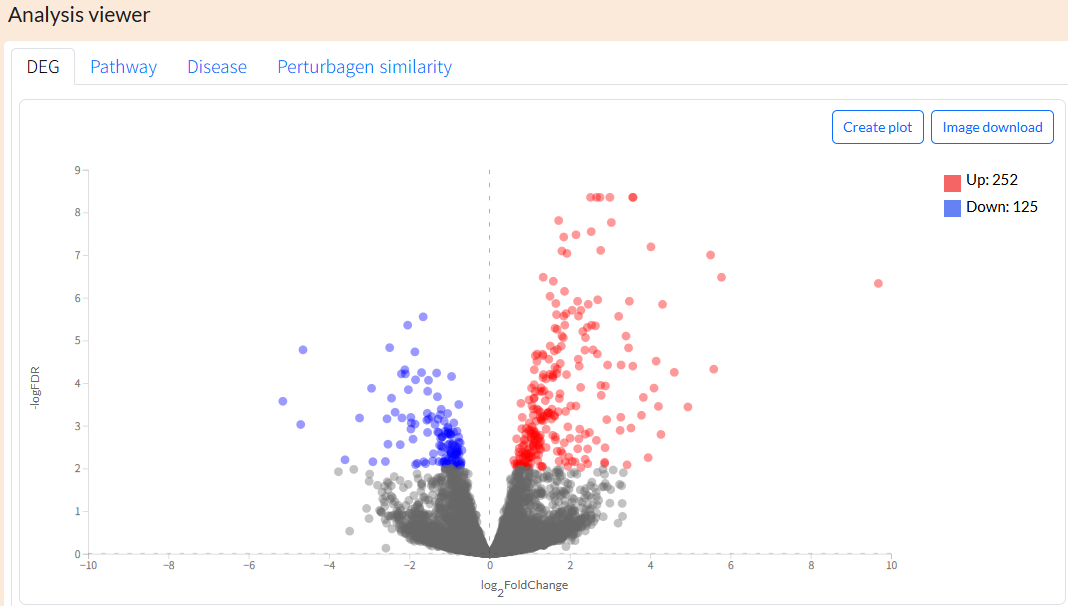
The DEG tab provides gene-level differential expression results for the selected signature profile.  For fold-change-based profiles, click Create plot to generate a volcano plot based on the selected DEG criterion.  Upregulated and downregulated DEGs are shown in red and blue, respectively.  Each point represents one gene; the x-axis indicates log2fold-change and the y-axis indicates −log10 adjusted P value.  For CMap profiles, a MODZ-ranked signature plot is displayed instead of a volcano plot.  Genes are ordered by rank on the x-axis, and the y-axis indicates the MODZ score.  The top 100 and bottom 100 genes are highlighted as the up- and down-regulated gene sets, respectively.
View DEG results
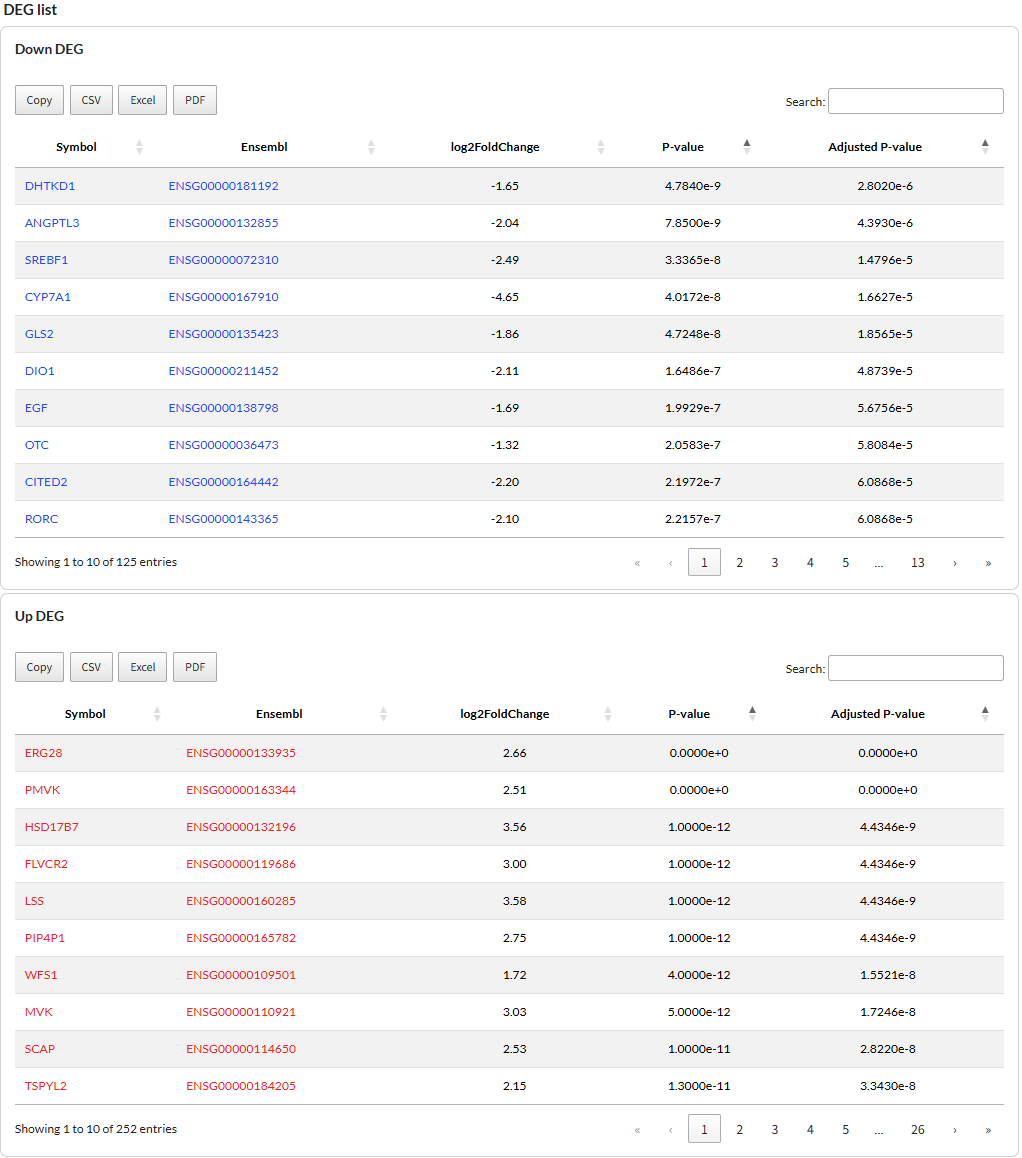
Upregulated and downregulated DEG lists are provided as separate tables below the plot and can be downloaded in CSV, Excel, or PDF format.
View DEG results

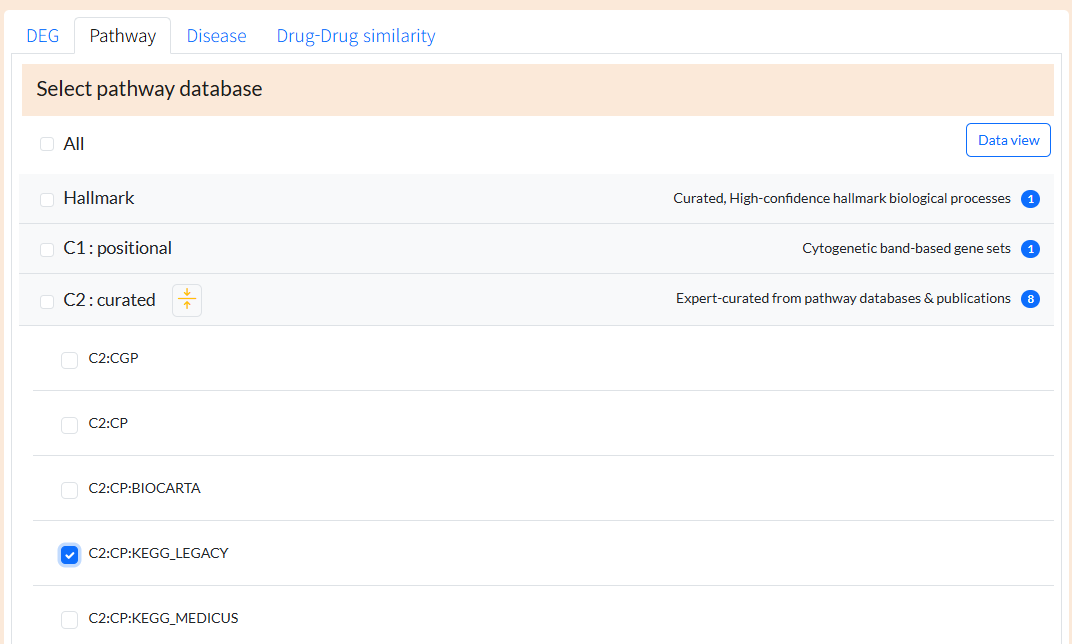
The Pathway tab provides pathway enrichment results for the selected signature profile. Pathway gene sets were obtained from MSigDB  Link.  Select one or more pathway databases from the list and click the Data view button.
View pathway enrichment results
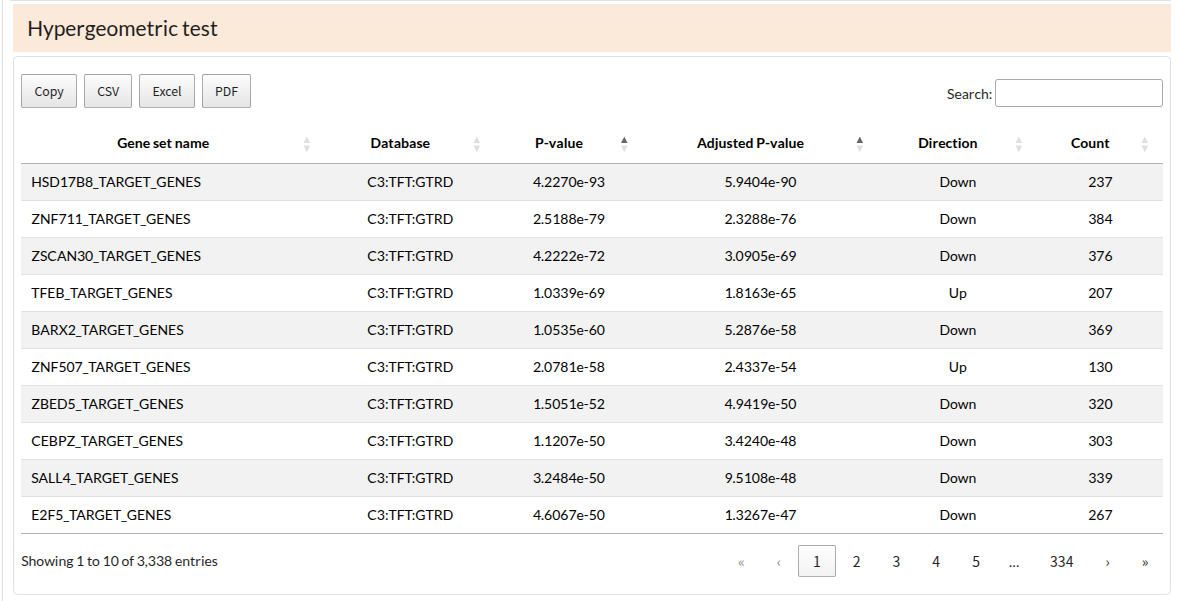
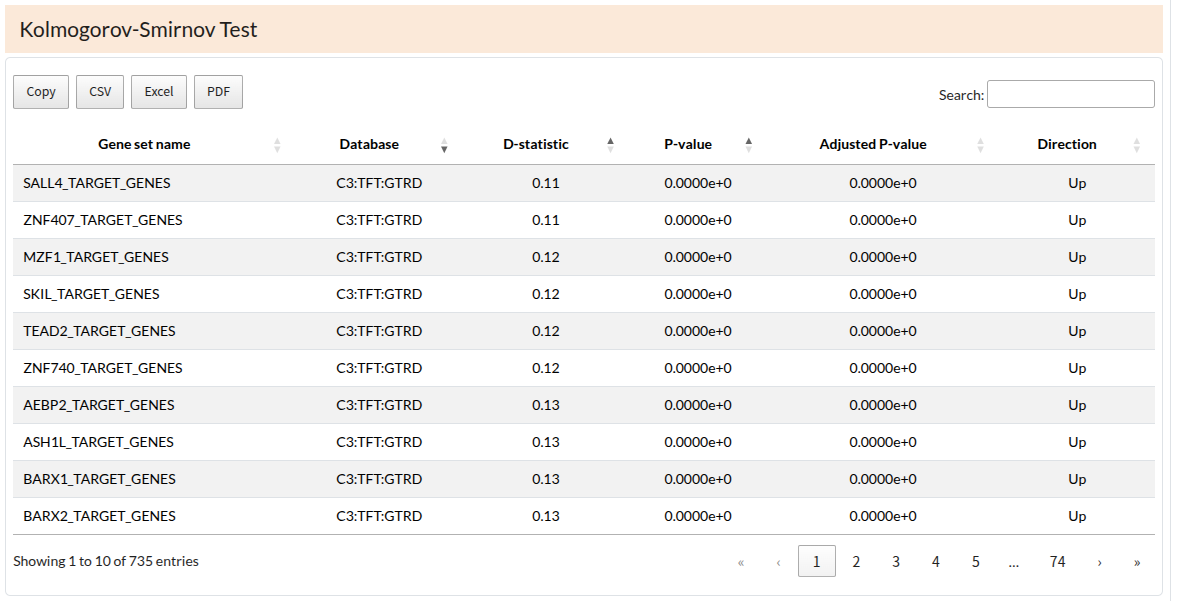
Results are provided for two input types: DEG-based gene sets and differential expression-ranked whole-gene lists.  DEG-based analysis uses genes passing the selected DEG cutoff and is tested using a hypergeometric test.  Ranked-list analysis uses all measured genes ranked by their differential expression between treatment and control and is tested using a Kolmogorov–Smirnov-based method.
View pathway enrichment results

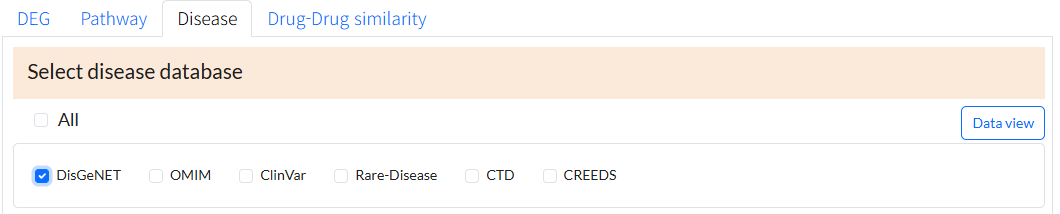
The Disease tab provides disease term enrichment results for the selected signature profile.  Disease-associated gene sets were collected from DisGeNET, OMIM, ClinVar, Rare-Disease, CTD, and CREEDS.
Disease database Description & Reference
DisGeNET A gene–disease and variant–disease association resource integrating and standardizing disease-associated genes and variants from multiple sources.  Link
OMIM A curated knowledgebase of human genes, phenotypes, and genetic disorders.  Link
ClinVar A public archive of human genetic variants and their reported relationships to diseases and clinical phenotypes.  Link
Rare-Disease (Enrichr) Literature-derived and co-expression-augmented rare disease-associated gene sets from Enrichr.  Link
CTD A manually curated toxicogenomics resource connecting chemicals, genes, phenotypes, diseases, taxa, and exposure information.  Link
Curated gene–disease data were retrieved from the Comparative Toxicogenomics Database (CTD), MDI Biological Laboratory, Salisbury Cove, Maine, and NC State University, Raleigh, North Carolina. World Wide Web (URL: https://ctdbase.org/). 2025.04.
Rows sourced from CTD are labeled "CTD" in the Database column.
CREEDS A resource of crowdsourced gene expression signatures extracted and reanalyzed from GEO, including disease-related signatures.  Link
Select one or more disease databases from the list and click the Data view button.
View disease enrichment results
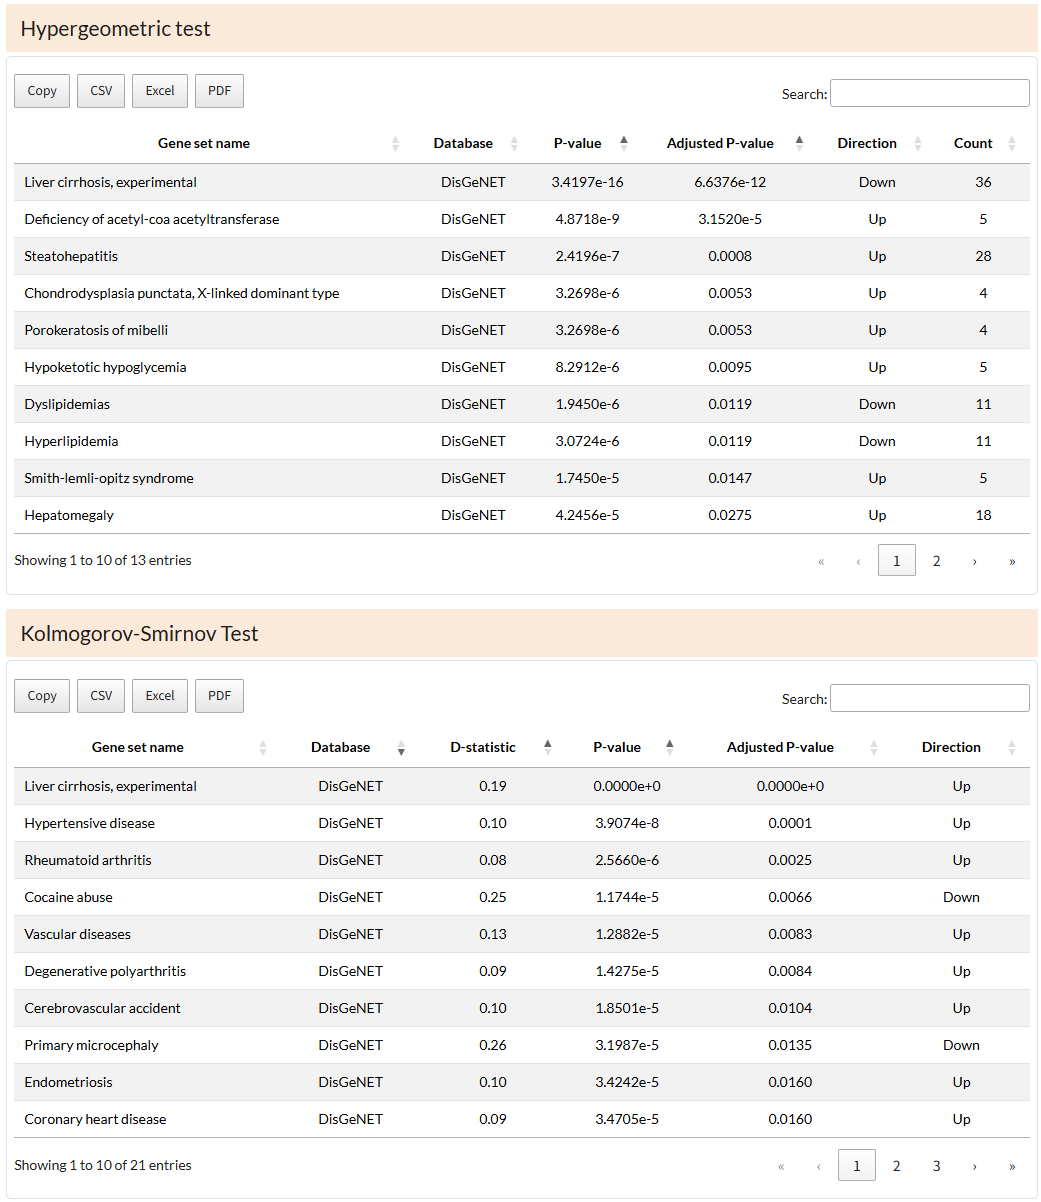
Results are provided in separate tables according to input type:  a hypergeometric test for DEG-based gene sets and a Kolmogorov–Smirnov-based test for differential expression-ranked whole-gene lists.  Each result table can be downloaded in CSV, Excel, or PDF format.
View pathway enrichment results

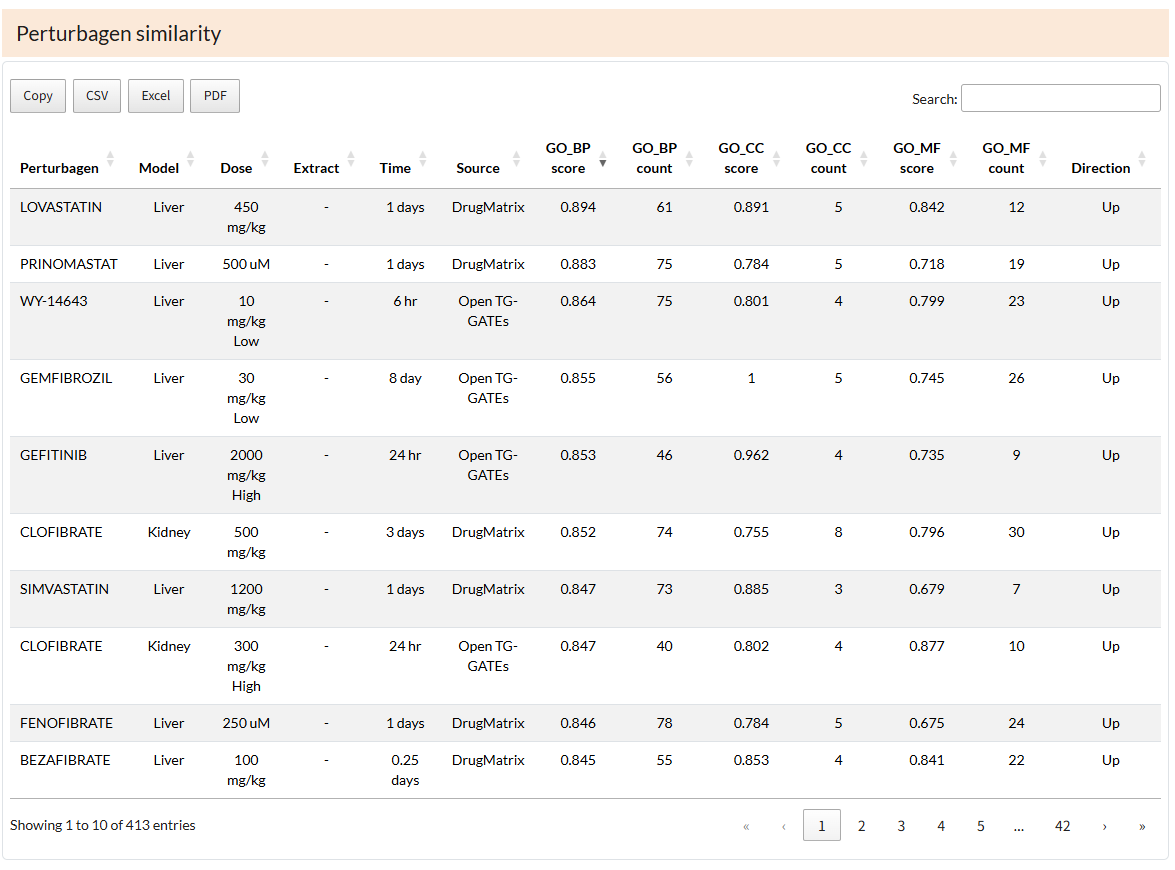
The Perturbagen similarity tab provides a ranked list of PSDAP signature profiles most similar to the selected signature profile.  Similarity is calculated using GOGO-based Gene Ontology semantic similarity analysis across the three GO aspects:  Biological Process (GO_BP), Cellular Component (GO_CC), and Molecular Function (GO_MF) https://doi.org/10.1038/s41598-018-33219-y.
Upregulated and downregulated gene sets are compared separately.
View drug–drug similarity results
Click Data view to display perturbagen similarity results. Each row represents a PSDAP signature profile compared with the selected profile.  The Direction column indicates whether the comparison is based on upregulated (Up) or downregulated (Down) gene sets.  Each row also provides the data source, experimental model, treatment condition, profiling platform, GO_BP, GO_CC, and GO_MF similarity scores, and the number of overlapping GO terms (count).  Results are sorted by GO_BP score in descending order by default and can be downloaded in CSV, Excel, or PDF format.
View pathway enrichment results
5. How to download data
The Download page provides two options: Single and Bulk.  Single download provides data for individually selected signature profiles based on perturbagen category, data source, experimental system, model, and perturbagen.  Two data types are available: Gene-level differential expression signatures and Profile metadata.
Download type Description
Gene-level differential expression signatures Gene-level differential expression results for selected signature profiles, including gene symbols, log2fold-change, P value, and adjusted P value.  Differential expression statistics were computed using methods appropriate for the data type and profiling platform.
Profile metadata Curated metadata for selected signature profiles. This file includes data source, experimental system, species, model name, treatment condition, and control condition. 
Bulk download provides access to the complete PSDAP dataset through a link to the external data repository.
6. Notes and limitations
PSDAP integrates heterogeneous public transcriptomic resources; therefore, metadata completeness may vary across data sources.  Only profiles with sufficient metadata and reliable treatment–control pairing are included.  Differential expression, pathway enrichment, disease enrichment, and perturbagen similarity results are computational annotations intended for hypothesis generation.  PSDAP will be updated annually with newly available datasets, revised metadata, and improved annotations.
7. Contact
For questions, bug reports, data issues, or suggestions for improvement, please contact the PSDAP development team.
@ Contact
Haeseung Lee, Ph.D.
College of Pharmacy, Pusan National University, Republic of KOREA